Canvas element as part of HTML5 has been creating a buzz all throughout the web standards community since its introduction, mainly because there are underlying question regarding its capability to change the
future of the web. But for some, it is an opportunity to them to start already on experimenting and developing a application that is based on HTML5.
HTML5 Canvas elements provide an important role for developing drawing objects dynamically such as visualizing information or data in a graph. With HTML5 canvas element it is easily to draw a two dimensional objects or drawing with the help of Javascript. Of course, these would work on any web hosting of your choice
For today’s post we’ve collected amazing library, demos and experiments that uses HTML5 canvas element that produces a charting and graphing solutions. We also added links for further readings and a step by step HTML5 tutorials on creating charts and graphs.
If you have a HTML5 graphs examples or spotted a HTML5 graphs that is not included on our list, feel free to put it on our comment section below.
Don’t forget to subscribe to our RSS-feed and follow us on Twitter — for recent updates.
You may also want to read the related posts below.
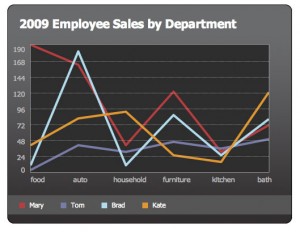
– Visualize uses a technique with the use of Javascript to get contents or data from a well-structured HTML table, and generate it with the use of native HTML5 canvas drawing ability to transform them into a chart or graph visualization.
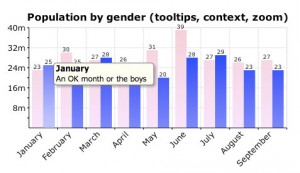
– rGraph is a HTML5 canvas graph library. It uses features that became available in HTML5 (specifically, the CANVAS tag) to produce a wide variety of graph types: bar chart, bi-polar chart (also known as an age frequency chart), donut chart, funnel chart, gantt chart, horizontal bar chart, LED display, line graph, meter, odometer, pie chart, progress bar, rose chart, scatter graph and traditional radar chart.
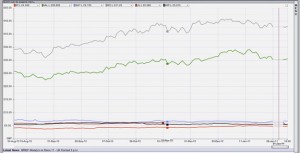
– iGrapher is a free web-based financial market visualisation tool for charting, analysis and prediction of different stock, currency and commodity markets. It uses canvas to draw the graphs of financial data.
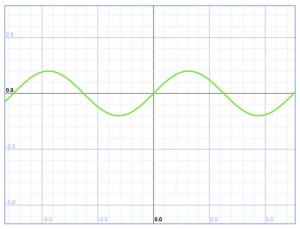
– A function plotter application is created by Ed Mackey, which plots 2D maths functions on to a graph using canvas.
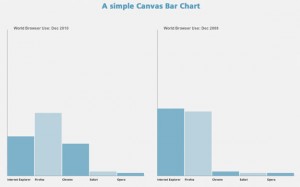
– Simple test for building a bar chart using HTML5 Canvas element and Javascript.
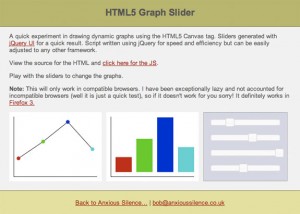
– A dynamic graph viewer that can accept data via javascript and update the graphs on the fly.
7. Graph.tk
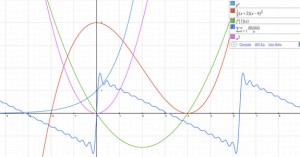
– Graph.tk is an online and open-source graphing utillity. It runs in any modern browser that supports the canvas element. It plots functions, and displays them with style.
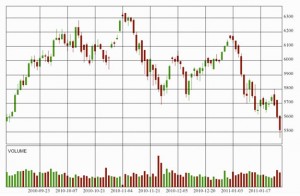
– Ticker plot is an opensource project that uses the canvas element for plotting the charts of ticker symbols and mouse events on canvas for panning and drawing trendlines.
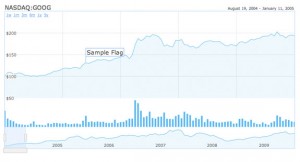
– Similar to the Google Finance Flash charting tool, HumbleFinance is a opensource project which uses HTML5 canvas element to generate data.
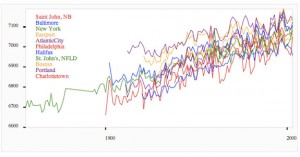
– A quick HTML5 canvas experiment to see what it offers for rendering charts.
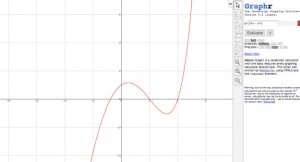
– Graphr is a JavaScript calculator with the basic features every graphing calculator should have.This script was written by Richard Ye, using HTML5 and the canvas element.
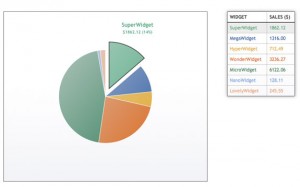
– An interactive pie chart using the latest HTML5 technologies, with a pretty nifty animated effects using nothing but JavaScript, CSS, and a small sprinkling of maths!
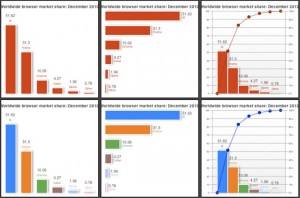
– AwesomeChartJS is a simple Javascript library that can be used to create charts based on the HTML 5 canvas element.
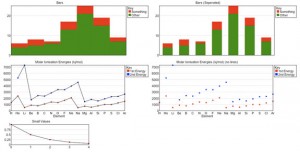
– jsGraph is a portable & lightweight javascript library for rendering charts and graphs using only javascript and HTML5.
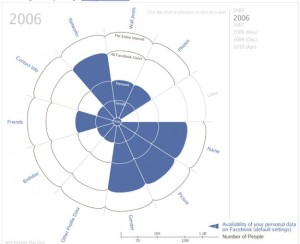
– A charting infographic developed in Prototype.js and uses a HTML5 canvas to draw the data.
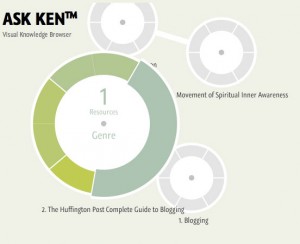
– ASK KEN™ is sort of a Node-Link diagram that allows to visually navigate through interconnected topics provided by the Freebase Service. It takes advantage of the latest HTML5 features by using the canvas element for drawing.
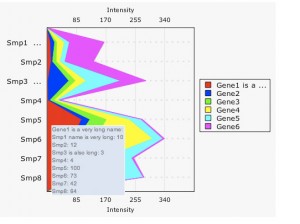
– CanvasXpress is a javascript library based on the canvas tag implemented in HTML5. It is a cross browser compatible library and works with all major browsers.
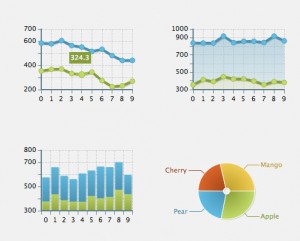
– If OpenSoure or Free version charts is not enough to your project needs you can ZingChart, first charting library that renders charts and graphs in both HTML5 canvas and Flash.
Further Readings:
The ultimate HTML5 Canvas element cheat sheet in PDF and PNG format.
Explore the ins and outs of Canvas with Think Vitamin’s article. Demonstrating what is possible with examples and links.
Explore HTML5 canvas with the given examples.
Step-by-step explanation getting started with HTML5 Canvas element.
W3Schools thorough explanation regarding HTML5 Canvas with basic examples.
A must read blog on testing the performance of HTML5 charts vs. Flex charts vs. Silverlight charts.
A perfect guide on using HTML5 canvas element.
5 Great HTML5 canvas tag implementations that are being used today on various websites and web apps.
A showcase of applications, games, tools, and tutorials that uses HTML5 canvas tag. It is great source of inspiration
Step-by-Step Tutorials on Creating Charts and Graphs
Do you agree that HTML5 is really the future of the web? Tell us what you think! Feel free to comment below.
And it doesn’t matter if your site is built in HTML5, PHP or the .net framework – seasoned developers understand the importance of web hosting that is dependable. So take heed!


