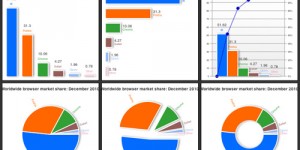
Plotting your data can serve as a replacement to tabular data, and is also a great way to add practical graphics to your web page or application. There are many ways you can plot data, but here I have included 15 Awesome Free JavaScript Charts In Your Sites/Blog Pages which serves as a easy Charting solution. Hope you like it.
RGraph: HTML5 & Javascript charts for your website
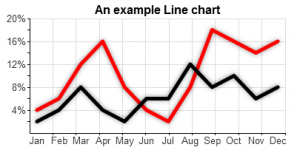
RGraph is a charts library written in Javascript that uses HTML5 to draw and supports over twenty different types of charts. Using the new HTML5 canvas tag, RGraph creates these charts inside the web browser using Javascript, meaning quicker pages and less web server load. This leads to smaller page sizes, lower costs and faster websites.
RGraph is free to use on non-commercial websites such as personal blogs, educational or charity sites.
Website: http://www.rgraph.net/
Demo: http://www.rgraph.net/examples/index.html
Some of the features of RGraph:
- Packed and fully documented
- Build faster websites with RGraph Javascript charts
- 20+ chart types
- HTML5 canvas based (so fast to draw)
- Works in Internet Explorer (using excanvas)
- Tooltips
- Resizing charts
- Annotating
- Simple API
TufteGraph
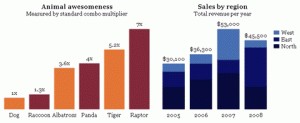
Make pretty graphs with javascript, using jQuery.
It is different from other javascript charting libraries because:
- Configuration is by dynamic functions, allowing for a really compact API (very few options)
- Non-core layout is done via CSS rather than code
Website: http://xaviershay.github.com/tufte-graph/
Download: http://github.com/xaviershay/tufte-graph/zipball/master
dygraphs JavaScript Visualization Library
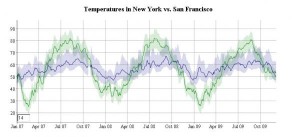
dygraphs is an open source JavaScript library that produces produces interactive, zoomable charts of time series. It is designed to display dense data sets and enable users to explore and interpret them.
Some of the features of dygraphs:
- Plots time series without using an external server or Flash
- Works in Internet Explorer (using excanvas)
- Lightweight (45kb) and responsive
- Displays values on mouseover (this makes it easily discoverable)
- Supports error bands around data series
- Interactive zoom
- Adjustable averaging period
- Can intelligently chart fractions
- Customizable click-through actions
- Compatible with the Google Visualization API
- Intelligent defaults make it easy to use
Website: http://www.danvk.org/dygraphs/
Demo: http://www.danvk.org/dygraphs/tests/
Highcharts
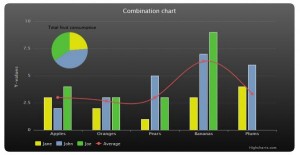
Highcharts is a charting library written in pure JavaScript, offering an easy way of adding interactive charts to your web site or web application. Highcharts currently supports line, spline, area, areaspline, column, bar, pie and scatter chart types.
Features:
- Compatible
- Free for Non-commercial
- Pure JS, no BS!
- Numerous Chart Types
- Simple Configuration Syntax
- Tooltip Labels
- Multiple Axes
- Events
- Datetime Axis
- Zooming
- External Data Loading
- Inverted Chart or Reversed Axis
- Text Rotation for Labels
Website: http://www.highcharts.com
Demo: http://www.highcharts.com/demo
gRaphaël—JavaScript Library
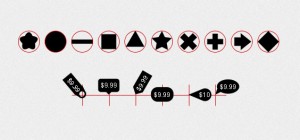
gRaphaël’s goal is to help you create stunning charts on your website. It is based on Raphaël graphics library. Check out the demos to see static and interactive charts in action.
gRaphaël currently supports Firefox 3.0+, Safari 3.0+, Opera 9.5+ and Internet Explorer 6.0+
Website: http://g.raphaeljs.com
Demo: http://g.raphaeljs.com
MilkChart
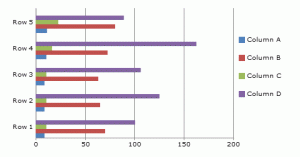
A simple to use, yet robust library for transforming table data into a chart. This library uses the HTML5 tag and is only supported on browsers other than IE until ExCanvas gets proper text support.
Website: http://code.google.com/p/milkchart/
Visualize
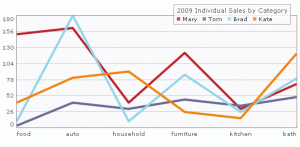
Accessible data visualization in HTML has always been tricky to achieve, particularly because elements such as images allow only the most basic features for providing textual information to non-visual users. A while back, we wrote an article describing a technique we came up with to use JavaScript to scrape data from an HTML table and generate charts using the HTML 5 Canvas element. The technique is particularly useful because the data for the visualization already exists in the page in structured tabular format, making it accessible to people who browse the web with a screen reader or other assistive technology.
Website: www.filamentgroup.com
InfoVis
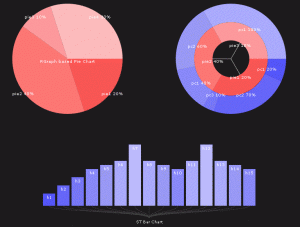
The JavaScript InfoVis Toolkit provides tools for creating Interactive Data Visualizations for the Web.
Website: http://thejit.org
Demo: http://thejit.org/demos/
Download: http://thejit.org/downloads/Jit-1.1.3.zip
jqPlot
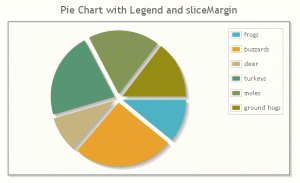
jqPlot is a plotting and charting plugin for the jQuery Javascript framework. jqPlot produces beautiful line, bar and pie charts with many features.
Features:
- Numerous chart style options.
- Date axes with customizable formatting.
- Up to 9 Y axes.
- Rotated axis text.
- Automatic trend line computation.
- Tooltips and data point highlighting.
- Sensible defaults for ease of use.
Website: http://www.jqplot.com
Demo: http://www.jqplot.com/tests/
Download: http://www.bitbucket.org/cleonello/jqplot/downloads/
Protovis
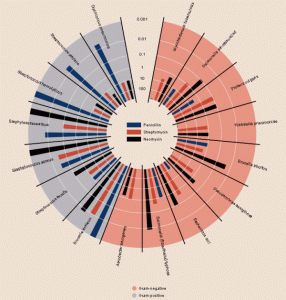
Protovis composes custom views of data with simple marks such as bars and dots. Unlike low-level graphics libraries that quickly become tedious for visualization, Protovis defines marks through dynamic properties that encode data, allowing inheritance, scales and layouts to simplify construction.
Protovis is free and open-source, provided under the BSD License. It uses JavaScript and SVG for web-native visualizations; no plugin required (though you will need a modern web browser)! Although programming experience is helpful, Protovis is mostly declarative and designed to be learned by example.
Website: http://vis.stanford.edu/protovis/
Demo: http://vis.stanford.edu/protovis/ex/
Download: http://protovis-js.googlecode.com/files/protovis-3.1.zip
Flot
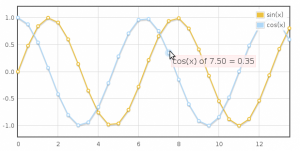
Flot is a pure Javascript plotting library for jQuery. It produces graphical plots of arbitrary datasets on-the-fly client-side.
The focus is on simple usage (all settings are optional), attractive looks and interactive features like zooming and mouse tracking.
The plugin works with Internet Explorer 6/7/8, Firefox 2.x+, Safari 3.0+, Opera 9.5+ and Konqueror 4.x+ with the HTML canvas tag (Internet Explorer where the excanvas Javascript emulation helper is used).
Website: http://code.google.com/p/flot/
Demo: http://people.iola.dk/olau/flot/examples/
Download: http://code.google.com/p/flot/downloads/list
API Google Chart
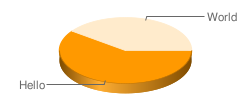
The Google Chart API lets you dynamically generate charts. To see the Chart API in action, open up a browser window and copy the following URL into the address bar:
http://chart.apis.google.com/chart?cht=p3&chd=t:60,40&chs=250x100&chl=Hello|World
Website: http://code.google.com/intl/ru/apis/chart/
Processing.js

Processing.js is an open programming language for people who want to program images, animation, and interactions for the web without using Flash or Java applets. Processing.js uses Javascript to draw shapes and manipulate images on the HTML5 Canvas element. The code is light-weight, simple to learn and makes an ideal tool for visualizing data, creating user-interfaces and developing web-based games.
Processing.js is explicitly developed for browsers that support the HTML5 element. Processing.js runs in FireFox, Safari, Opera and Chrome but will not be supported in Internet Explorer until Mircosoft catch up with ISSUE 15.
Website: http://processingjs.org/
Demo: http://processingjs.org/learning/ide
Download: http://processingjs.org/download
MooWheel
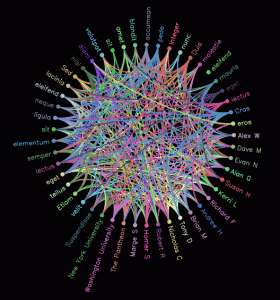
The purpose of this script is to provide a unique and elegant way to visualize data using Javascript and the object. This type of visualization can be used to display connections between many different objects, be them people, places, things, or otherwise. The script is licensed under an MIT-style license.
This script requires three libraries to support it. CanvasText (for text support with canvas elements), ExCanvas (for IE canvas support), and MooTools 1.2; all three are included in the package. View the project on Google Code.
Website: http://www.unwieldy.net/projects/moowheel/
Demo: http://www.unwieldy.net/projects/moowheel/demo/large.html
Download: http://moowheel.googlecode.com/files/moowheel_v02.zip
JSXGraph

JSXGraph is a cross-browser library for interactive geometry, function plotting, charting, and data visualization in a web browser. It is implemented completely in JavaScript, does not rely on any other library, and uses SVG and VML. JSXGraph is easy to embed and has a small footprint: less then 100 KByte if embedded in a web page. No plug-ins are required!
Features:
- Euclidean Geometry: Points, lines, circles, intersections, perpendicular lines, angles
- Curve plotting: Graphs, parametric curves, polar curves, data plots, Bezier curves
- Differential equations
- Turtle graphics
- Lindenmayer systems
- Interaction via sliders
- Animations
- Polynomial interpolation, spline interpolation
- Tangents, normals
- Initial support for charts
- Vectors
Website: http://jsxgraph.uni-bayreuth.de/wp/
Demo: http://jsxgraph.uni-bayreuth.de/wp/examples/
Download: http://jsxgraph.uni-bayreuth.de/wp/download/
Prototype + Canvas = ProtoChart
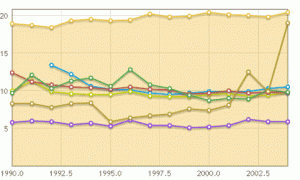
ProtoChart is a new opensource library using Prototype and Canvas to create good looking charts. This library is highly motivated by Flot, Flotr and PlotKit libraries.
Features:
- Line, bar, pie, curve, mix, and area charts available
- Multiple data series on same graph
- Highly customizable legend support
- Customizable grid, grid border, background
- Customizable axis-tick values (both x and y)
- Supports: IE6/7, FF2/3 and Safari
- Even works on an iPhone!
Website: http://www.deensoft.com/lab/protochart/
Demo: http://www.deensoft.com/lab/protochart/linechart.php
jQuery Sparklines

This jQuery plugin generates sparklines (small inline charts) directly in the browser using data supplied either inline in the HTML, or via javascript.
The plugin is compatible with most modern browsers and has been tested with Firefox 2+, Safari 3+, Opera 9, Google Chrome and Internet Explorer 6, 7 & 8.
Each example displayed below takes just 1 line of HTML or javascript to generate.
Website: http://www.omnipotent.net/jquery.sparkline/
Demo: http://www.omnipotent.net/jquery.sparkline/
Download: http://www.omnipotent.net/jquery.sparkline/#download


