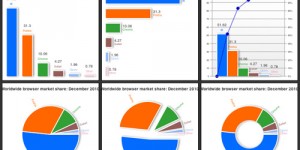
A plethora of amazing free Javascript plugins for plotting charts and graphs are now present online. Many good charting libraries are available. The rapid increase in the availability of this kind of plugins is because of the fact that people are no longer dependant on Flash. Modern browsers and sophisticated computing has made it easy to render live data. Advancement in various vector drawing technologies like VML, SVG and Canvas has also made it possible.
So today we have a list of 10 Awesome Javascript Plugins For Plotting Charts and Graphs. Some of these plugins use various technologies, thus supporting canvas only requiring modern browsers; while others integrate different technologies together to allow it to work on different platforms and older browsers. Some of these tools are framework independent and most of them support the usuals: bars, lines, pies; while some supports more complicated ones like correlation plots, Venn diagrams, heatmaps, newick trees, 2D-scatter plots, 2D-scatter bubble plots, 3D-scatter plots. So check out the list and pick the ones that suit your needs the best!
If you like this article, You May like Our Other Articles on Top 50 JavaScript, JavaScript Tools For Developers and JavaScript Sliders.

This one is a really nice HTML5 data visualization tool. It is quite similar to the Flash tool available on http://finance.google.com/. Humble Finance itself is written completely in JavaScript, utilizing the Prototype and Flotr libraries. You can use it for displaying any two 2-D data sets of real numerical data that share the axis.

Advertisement
D3 is one of the most popular visualization library. It is utilized by a few chart plugin in this post. It allows binding arbitrary data to a DOM (Document Object Model ), and then applying data-driven transformations to the document. You can use it for creating a basic HTML table from an array of numbers; or utilize the same data for creating an amazing SVG bar chart with fluid transitions and interaction.

Rickshaw is an amazing tool that lets you create interactive time series graphs. It D3 visualization library dependant and requires some extensions like jQuery and jQuery UI.

This is a great plugin for plotting and charting for jQuery Javascript framework. jqPlot creates amazing line, bar and pie charts with various features.

It is a HTML5 JS charts library that boasts support for more than 20 types of charts. Utilizing the latest HTML5 canvas tag, this tool generates Javascript charts in the web browser, which means that pages would be quicker and web server load would be less. This tool is a great way of speeding up your website.

This one is a really amazing open source JS library that creates interactive, zoomable charts of time series. It allows displaying dense data sets and lets users explore and interpret them. It is a minimal tool that even works in IE too.

This one is a library based on the tag applied in HTML5. It supports a huge amount of extremely complicated charts and graphs.

This tool allows creating beautiful charts on your website. gRaphael is based on Raphael graphics library. You can also viewe the demos to see static and interactive charts. It presently supports Firefox 3.0+, Safari 3.0+, Opera 9.5+ and IE 6.0+.

It is a great framework independent library which allows drawing HTML5 charts and graphs. It is actually a branch of flotr that gets rid of the Prototype dependence and boasts various meliorations. You can create lines, bars, candles, pies and bubbles charts. It even supports older browsers like Internet Explorer 6 and mobile platform too.

Well, as the name suggests, it is an ‘awesome’ Javascript library which can be used for creating charts based on the HTML 5 canvas element. It is a simple library which allows users to generate simple charts easily and quickly with a few lines of coding.


